On Friday 20th of July, I visited the Bloomberg Headquarters in London for my second Bloomberg in Education symposium. The day-long event was attended mostly by academics, but there were also a few familiar faces from the Business Librarians Association. The day was filled with talks from academics who have integrated Bloomberg into teaching or have recently got Finance Labs, each reinforcing the message that Bloomberg is an invaluable asset to universities, well worth the investment.
Frankly, many of the more technical parts to the talks went a little over my head, but below are a few really interesting highlights I took away from the day.
Key points from the lectures
1. The next version of Bloomberg Market Concepts will be updated with more recent examples and will have a greater focus on the operationally of the Bloomberg terminal (Dmitri Belopolski)
2. Crypto currencies, like Bitcoin, can be found in Bloomberg, and they’re treated as assets rather than as currencies themselves. While users can track their current value, see related news stores, and learn all about cryptocurrencies, Bloomberg does not enable users to trade them. They do not have any plans to in the near future, as banks do not currently recognise them as official currencies. (Oliver Woolf, Market Specialist for Technical Analysis and Data Visualisation, Bloomberg)
3. Scott Ellis of Northumbria University has created a series to getting started videos for his Banking and Finance students. He updates them frequently and has found they get more engagement than the guides he initially wrote. Ellis argued that students were more likely to engage with his content than the general information from Bloomberg because it had been tailored to the needs and purposes of the students.
4. At the IESEG School of Management in Lille and Paris, Dr Renaud Baupain has students consider their favourite Bloomberg function or the Bloomberg function which is most relevant to them and why. This might be something I do to wrap up Bloomberg workshops going forward.
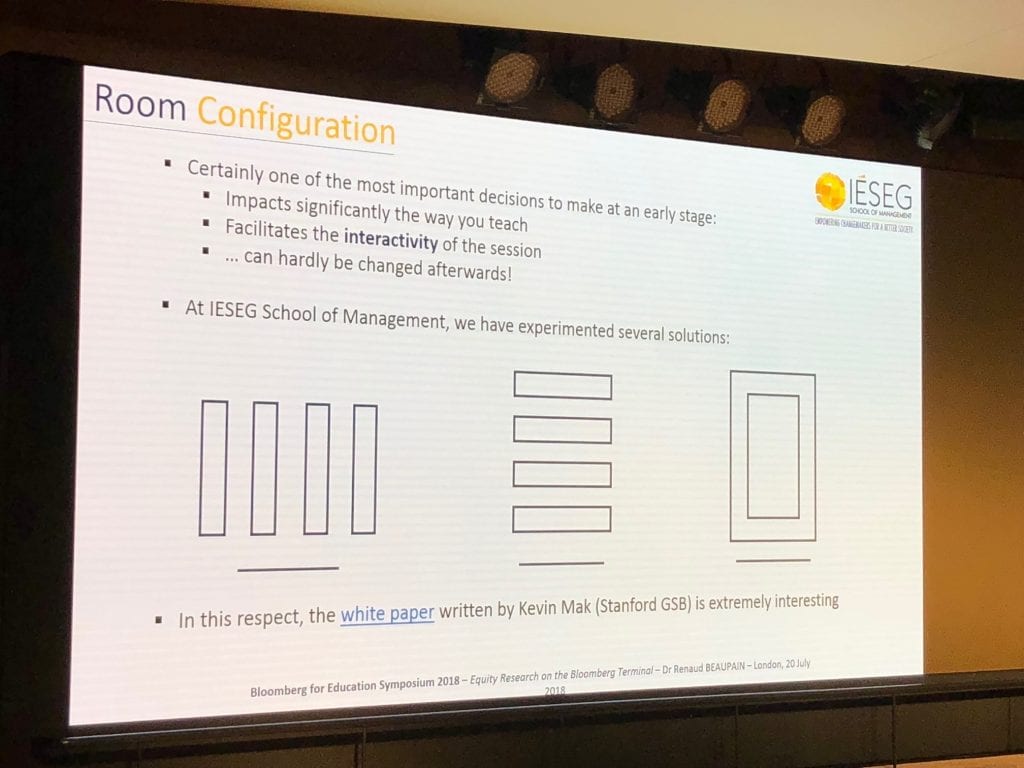
5. Dr Baupain covered the current configuration of their finance labs. A fair bit of research has gone into the setup of finance of labs. He concluded that there are three (or four) basic arrangements. More information can be found in Kevin Mak’s white paper from Stanford Graduate School of Business, Building an Investment Lab.
- Benches – wherein desks are arranged in rows and the focal point of the room is to the left or right of the students (easy for students to work in groups, easy for the lecturer to reach the students who have questions, efficient use of space).
- Rows – The traditional classroom setup, wherein students are seated in rows with the focal point at the front of the room (efficient use of space, difficult for students to work in groups, difficult for the lecturer to reach the students in the middle)
- Pods – Students are in pods of dotted around the room (easy for students to work in groups, easy for the lecturer to reach the students who have questions, inefficient use of space)
- Circle or horseshoe (Easy for lecturer to reach the students, Difficult for students to work in groups, efficient use of space)

Functions
The day was filled with Bloomberg functions, including some of my favourites: DES, SPLC, GP and PEOP for finding and contacting alumni. (Yes, I realise having favourite Bloomberg functions makes me a massive nerd – please see the banana below for my reaction.) One of the main reasons I attended was to learn about the new functions Bloomberg has been developing this year. Turns out, there are a lot.
Featured Functions
CFAPRO – CFA Pro is intended to be used directly alongside the CFA program curriculum chapter by chapter. Students carry out relevant exercises corresponding to concepts discussed in the curriculum.
DOCS Documents folder of research carried out by Bloomberg staff. I don’t think this function is particularly new; it’s just new to me.
GT – Social Chart. Bloomberg algorithms track Twitter sentiment. Wondering how a recent event in the news about a company has affected its stock price? Check out Social Chart. The results might surprise you.
BI ECON – portal of economics data and analysis. This was demonstrated to us in the context of the Trump Trade Wars and shows, among many other indicators, the effects of tariffs.
ECTR –it charts countries’ trade relationships with other countries. It’s like SPLC but for countries, instead of companies.