There has been great interest in Big Data for learning analytics, to the point where Dr. Martin Rich (@MartinRich106) and I (@bunhill) have argued for Small Data, for example at the Learning at City Conference back in June 2017. We define this as:
“The smallest amount of data that can provide actionable information, eg on student engagement, without front-line academics needing specialist expertise..”
We argue that quick and simple data in the hands of those directly involved with students is of crucial significance, but fails to be prioritised institutionally, in part because it can’t be packaged as a “project”. The aim of this post is to provide some practical advice on Small Data.
Here is a very important example of we what have been using in weeks 1-2 of this term 1. We first want to see which students have not accessed Moodle. Lisa Baker of LEaD has nicely summarised what needs to be done:
"Data on students who have not accessed a Moodle module is available under the Participants link. Click on the Module menu (top red bar), then select Participants and Participants again in the next menu. Under the User List menu (set to User Details) select Brief. This view then shows different column headings and you can sort the list by Last Access to Course."
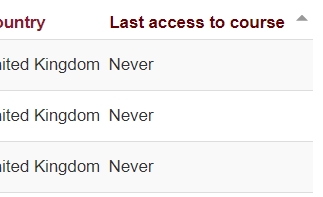
We cut and paste the details of those with “Never” to a spreadsheet.
In several modules we deliberately set a small piece of coursework to be uploaded in week 1 for quick turnround. This additionally helps us to see who is not engaged. By then using the Moodle Grading Summary we can, by parallel means to Lisa’s example, generate more data for our spreadsheet. For a current module with 175 registered students, the “Never Moodled” group has 16 students, while a further 19 had not submitted coursework at the date we checked. We know from past experience that the group of 16 will include some students who have registered but never turned up, and others with IT problems. The group of 19 have overcome their technical problems, but were probably unprepared for small quick coursework in week 1.
The final piece of small data is an attendance register for the first 2 weeks classes, allowing triangulation to take place through our spreadsheet and helping us decide which students need specific encouragement and support at this very early stage of the year.
Even if you haven’t got a formal task such as coursework in week 1 or 2, you can upload a specific document or weblink which you then request students to download and read. This can be tracked through Reports/Course Participation as below:
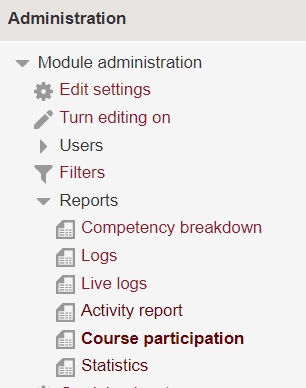
You select the Moodle Activity you want to track. In the example below we are tracking a specific document, for the whole 2 weeks of term so far, for students and if they viewed it:
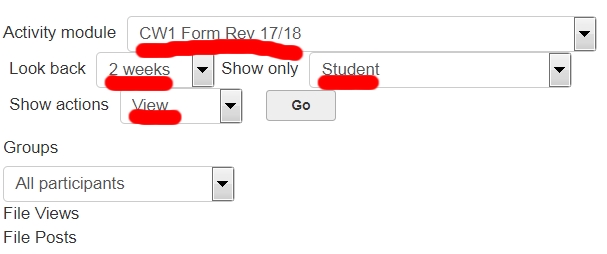
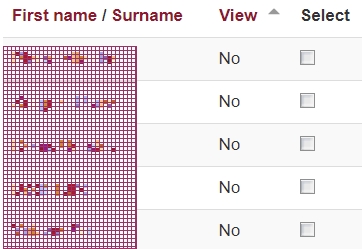
This generates a list of students, which can be sorted by the number of views – we are only interested in No access as below. You can then in a few seconds select all the “Nos” and email them a suitably worded reminder to download the file. This is no guarantee of it being read, but it is in most cases a precondition!
None of the above skills need a training course, but they will benefit from your own thinking through what you expect students to have done by when, and using some basic features of Moodle design and reports.
