
Earlier this year, I attended the HEA STEM 2016 conference. This post details some of the highlights from the event.
With a conference theme centred around inspiring, supporting and sharing excellent practice in STEM teaching and learning, I was particularly interested in sessions that focused on innovations in STEM teaching. I found inspiration at ones run by Dr Daniel Burgarth of Aberystwyth University and Dr Katherine Haxton from Keele University. Burgarth spoke about and demonstrated his investigations in teaching mathematics with tablet devices, while Haxton took the audience through her experiences of using infographics as assessment tools in Chemistry teaching.
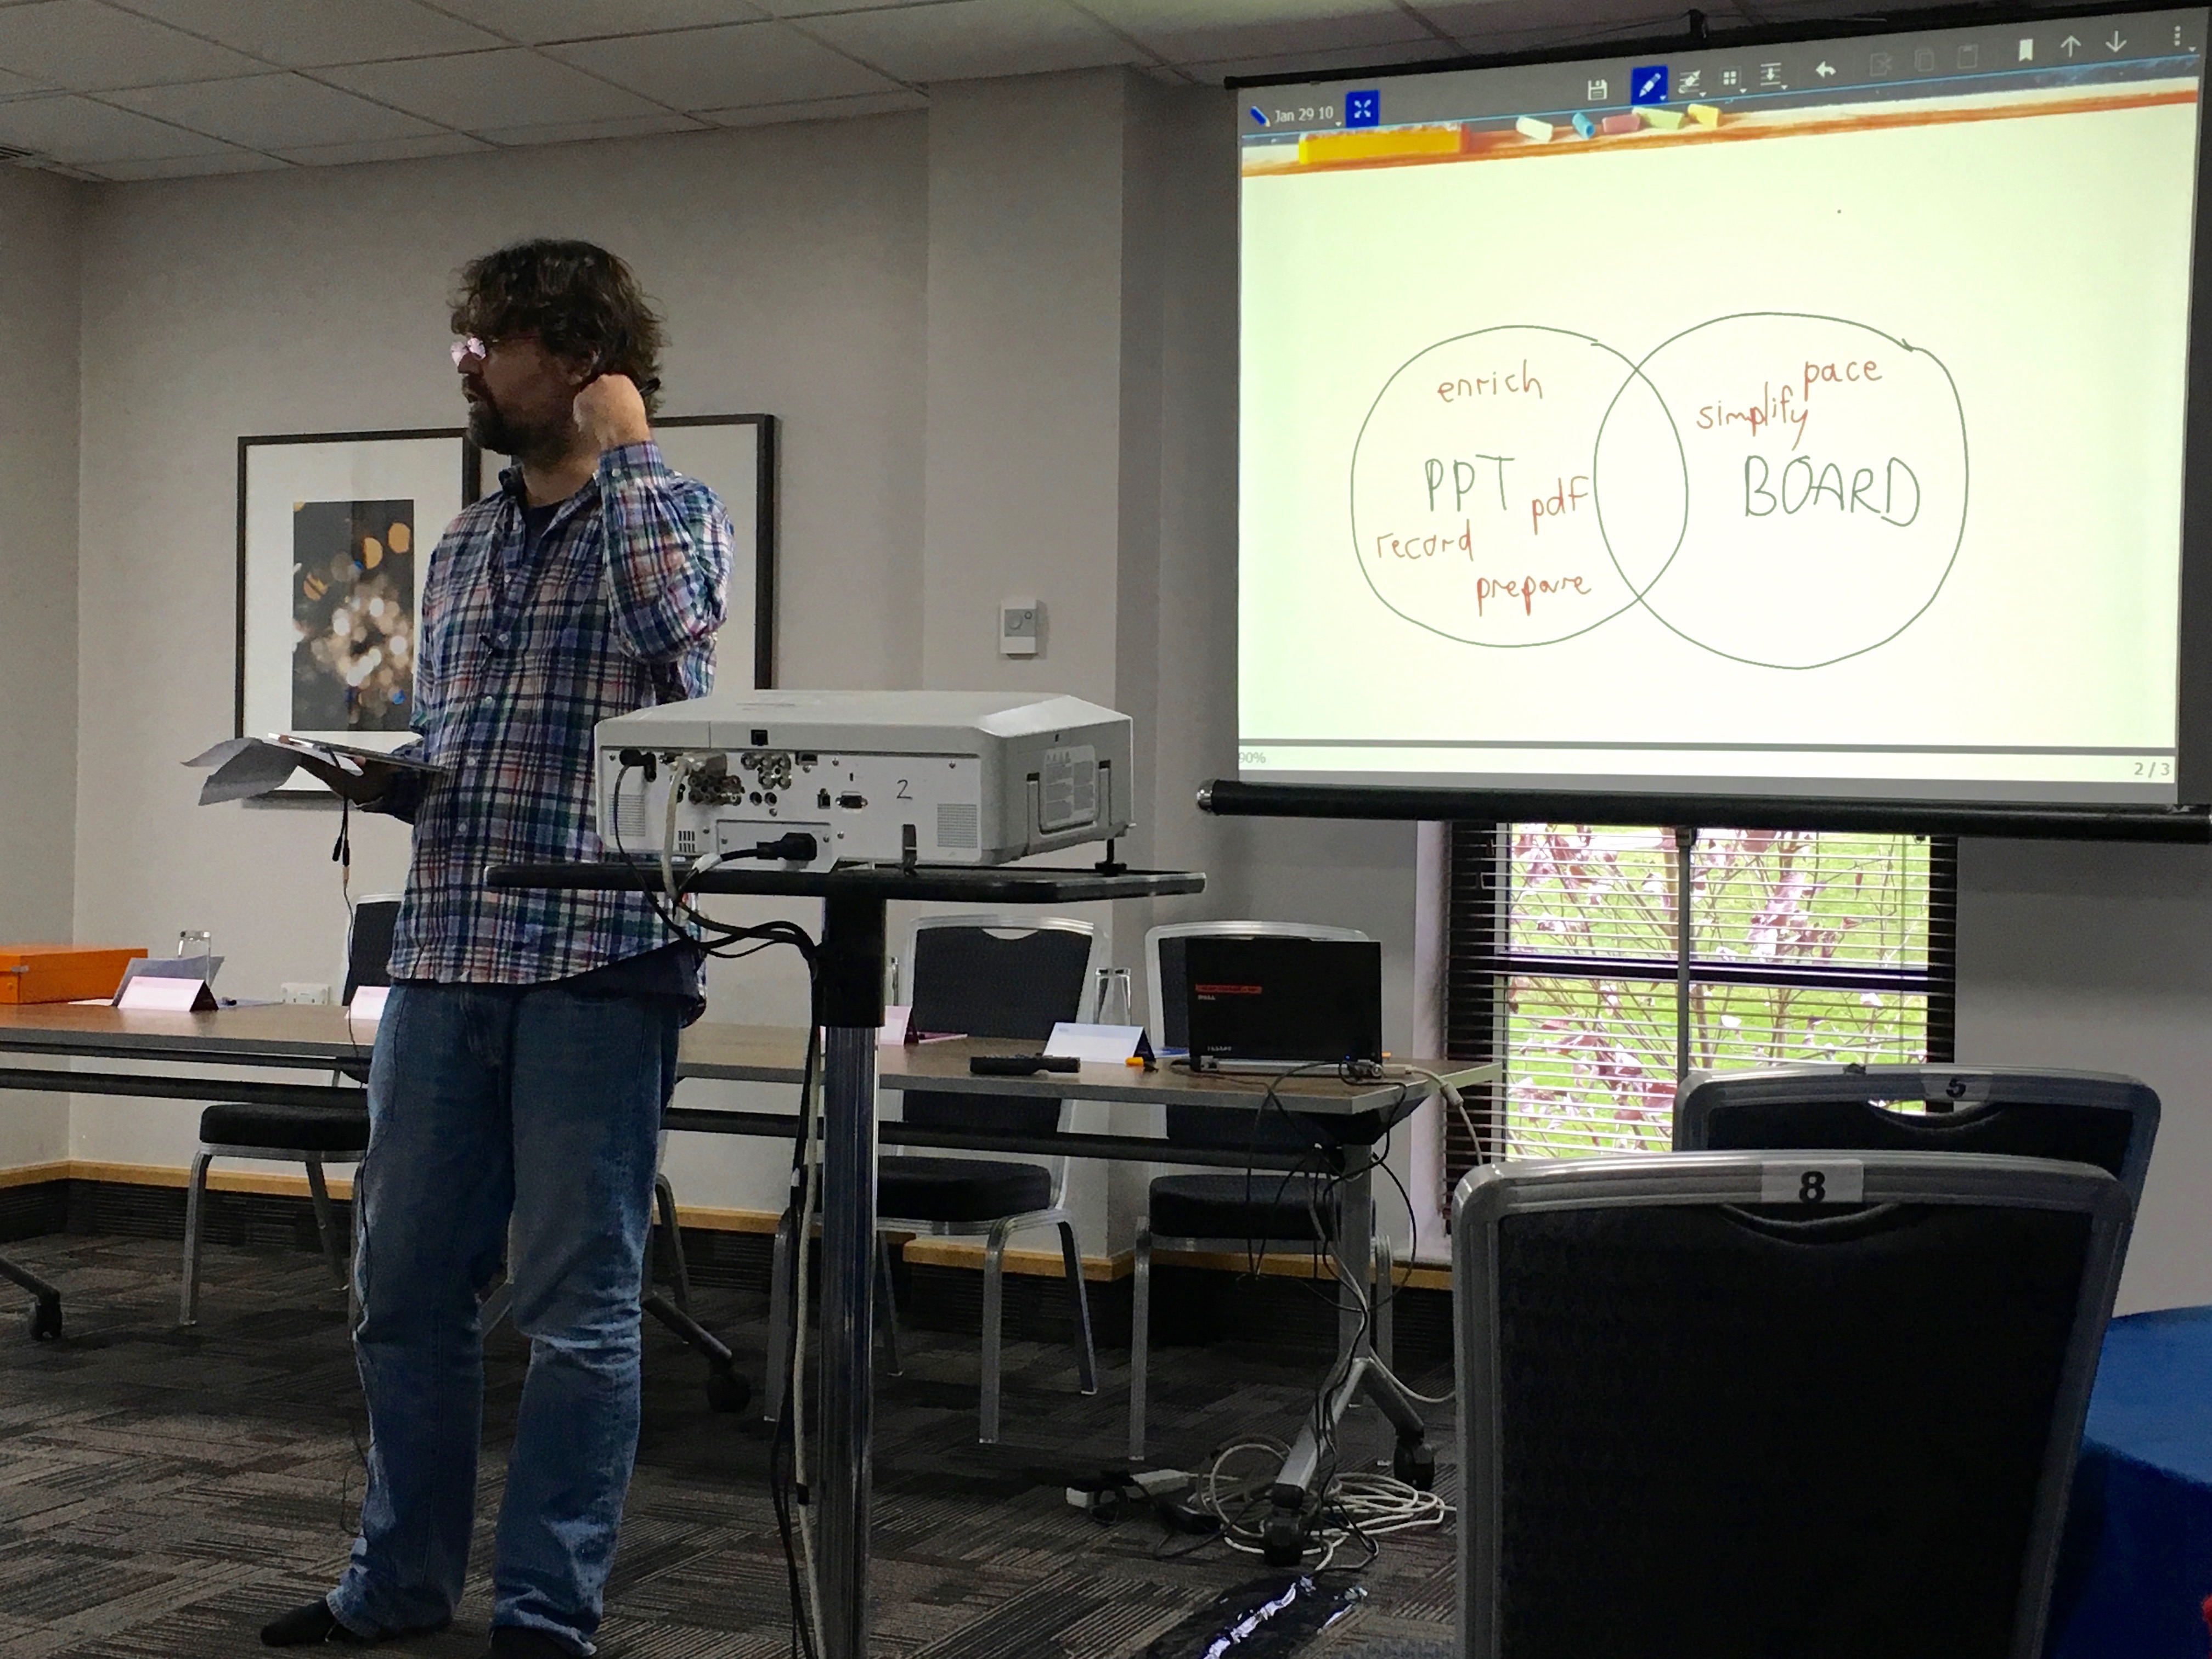
For Burgarth’s session, the room was laid out in a welcoming cabaret-style, with a Samsung Galaxy tablet on each table. Recounting his rather bold experiments in using tablets in his teaching, Burgarth drew his presentation slides as he went along. When presented in ‘Lecture Mode’, these drawings also appeared in real time on the screens on our tables as well as the main room projector. He used an Android app produced by Stylus Labs, and had settled on this solution as closest to meeting his needs, also working closely with the software developers to help shape their product to better meet his specific teaching requirements. With the addition of a small clip mic, the session was fully recorded and made available to participants on YouTube straight after the event.
Of particular interest was the post-presentation activity, where the assembled participants were given a ‘multiplayer’ Sudoku puzzle to solve. This demonstrated group inputs into a collective problem, which was an inventive demonstration of collaborative learning (also described on Twitter as ‘scary’ for a lecturer!). You can see another example of this technology in action at a presentation Burgarth gave to a 2015 Schoms conference.
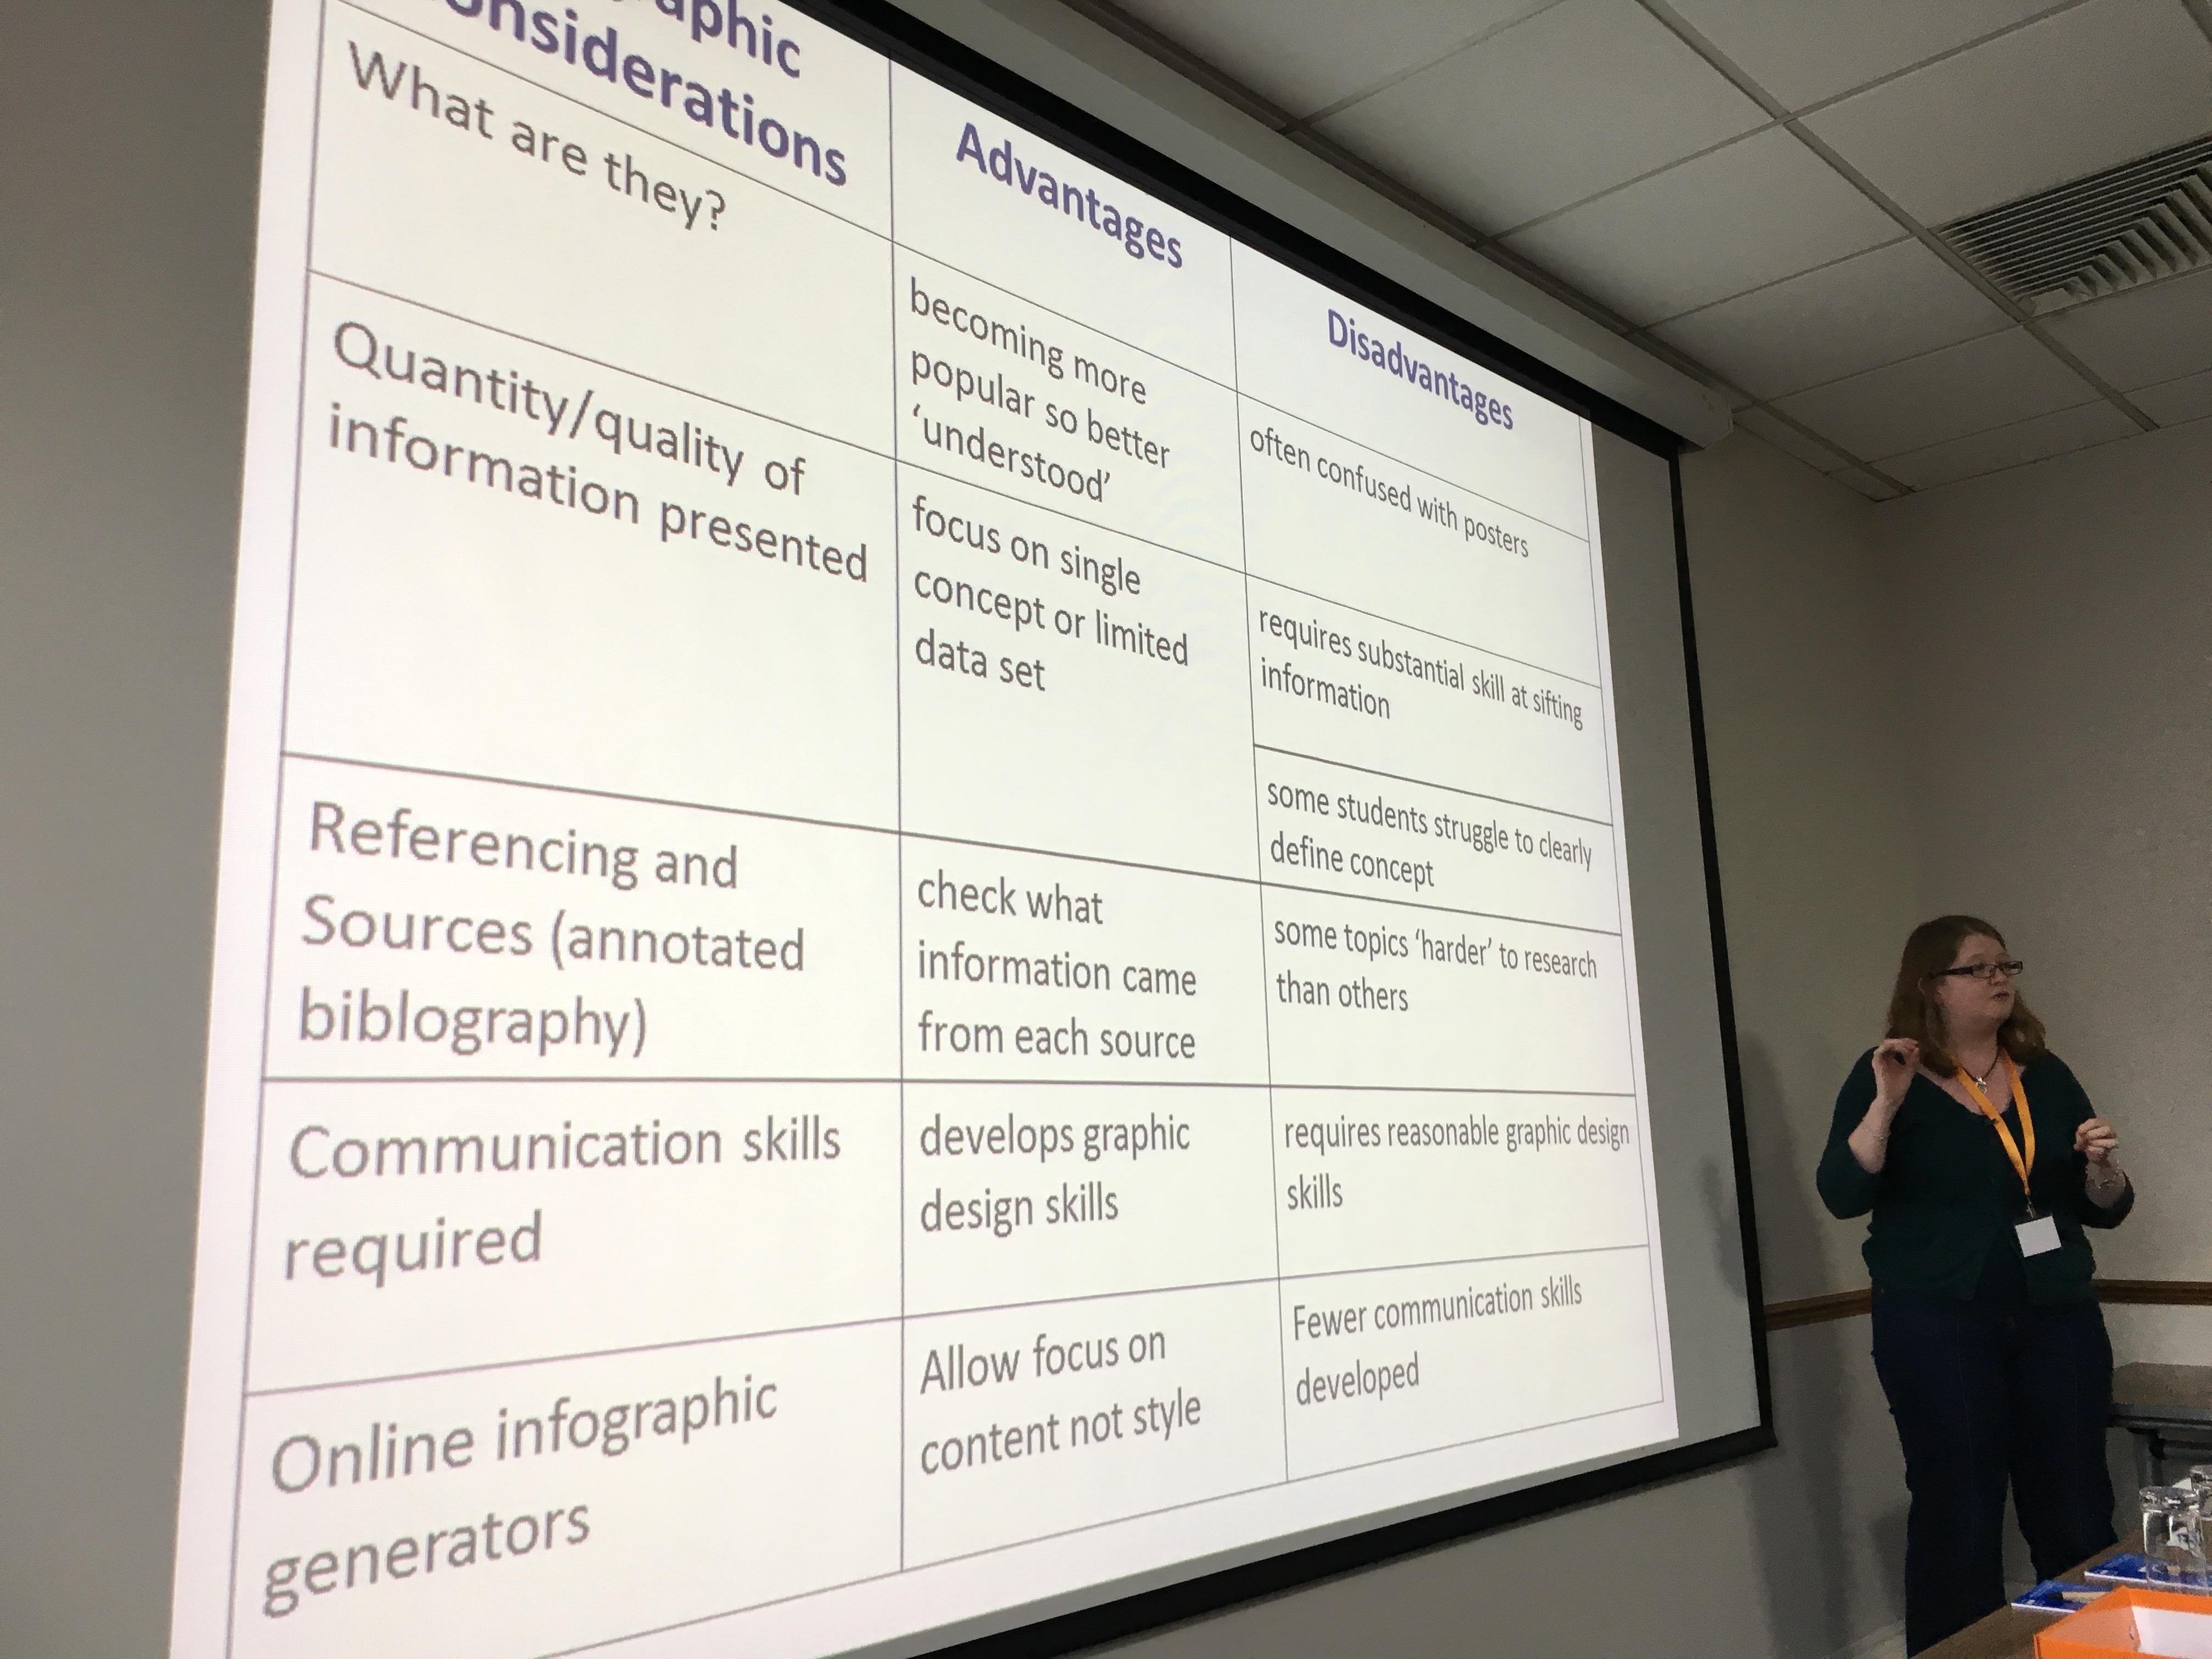
Haxton’s post-lunch session was titled ‘Developing conceptual understanding through alternative assessment’, and was delivered to a packed house. Referencing a point raised in the earlier keynote of the importance for students of grasping concepts over content, she suggested that she had chosen infographics as a ‘human-friendly way’ to assess understanding of those concepts. This novel approach was introduced in a third year module, comprising 15% of the final grade (10% for the production of the infographic, 5% effort-based through peer assessment) as an alternative to producing an academic poster. Laying out the advantages and disadvantages of using this technique, she also recounted the lessons learned from the experience and the response from her students – one of whom suggested that this style of assessment ‘should be added earlier into the course’.
On the presentation front, I was also impressed at her use of scheduled tweets for sharing key resources that expanded on or related to her slides. This highlighted the importance of keeping to time when presenting! Haxton’s slides can be viewed here. The site she used for students to produce infographics was Piktochart (which has free account usage).
What examples of collaborative problem-solving have you seen or brought to the classroom? What alternative approaches to assessment have you seen working well?
